If you follow the stock market, you have probably come across statements like stocks are expensive or overvalued, or this stock is cheap or undervalued. Whatever the terms, what is the point of reference for these opinions?
There are many ways to measure the value of a stock or the market as a whole, but the most common is the price/earnings (P/E) ratio. The P/E ratio is calculated by dividing a stock’s current price per share by the company’s earnings per share over a 12-month period. This ratio quantifies what investors may be willing to pay for one dollar of earnings.
For example, a P/E of 20 means an investor would pay $20 for every $1 the company earns over the 12-month period. By this standard, a stock with a P/E of 25 could be considered more “expensive” than a stock with a P/E of 20, regardless of the share price. A higher multiple also indicates that investors may expect higher growth from the company compared to the overall market.
Past and future
The most commonly referenced type of P/E ratio is trailing P/E (abbreviated TTM for trailing twelve months), which is based on the official reported earnings per share for the previous 12 months. Earnings are typically reported on a quarterly basis, so the earnings part of the trailing P/E equation will generally remain the same for each three-month period, but the stock price may change every trading day, making the trailing P/E a moving target even though it measures past performance.
Forward P/E (or projected P/E) uses projected earnings over the next 12 months, based on information released by the company. The forward P/E will also change with stock prices and updated earnings projections. Although this is important information for investors, the actual earnings could turn out to be very different from the projection.
Use valuations wisely
Knowing a company’s P/E ratio may be important, but only if you use it to make appropriate comparisons. P/E ratios can vary widely among industries, so it is generally more meaningful to compare ratios of companies in the same industry or one company against the industry average.
You might also compare a company’s current and past performance, but keep in mind that P/E ratios typically rise and fall with stock prices; if prices rise and earnings stay about the same, P/E ratios increase, and vice versa. So an increase or decrease in a company’s P/E ratio that moves with the broader market may not tell you much about the company’s performance.
Different Industries, Different Ratios
Some industries tend to have higher P/E ratios than others over an extended period, but ratios can change with investor sentiment or industry challenges and opportunities.
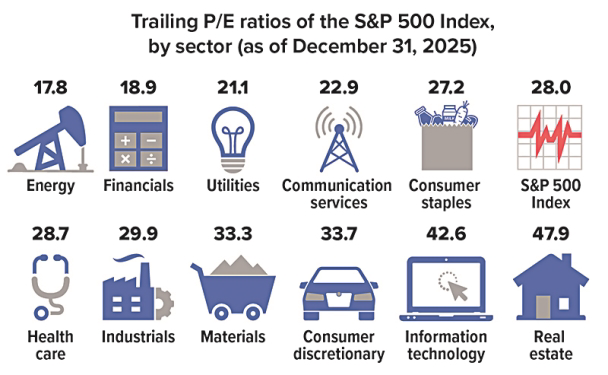
Source: S&P Dow Jones Indices, 2025–2026. The S&P 500 is an unmanaged group of securities that is considered to be representative of the U.S. stock market in general. The performance of an unmanaged index is not indicative of the performance of any specific investment. Individuals cannot invest directly in an index. A portfolio invested only in companies in a particular industry or market sector may not be sufficiently diversified and could be subject to a significant level of volatility and risk.
On the other hand, a substantial change in a company’s P/E ratio that is not in step with the market could be caused by an unexpected increase or decrease in reported or projected earnings, or by a shift in investor confidence in the company. The same is true of a change in the P/E ratio of an industry that diverges from broader market trends.
Higher-than-average P/E ratios
At the end of 2025, investors were paying $28 for each dollar of corporate earnings from companies in the S&P 500 Index, according to the trailing P/E ratio. This is higher than the five-year average trailing P/E of 25.0 and the 10-year average of 23.0. The forward P/E ratio was 22.0, above the five-year average of 20.0 and the 10-year average of 18.7.1–2
Because both types of P/E ratios are based on the current share price, the fact that the forward P/E was lower than the trailing P/E suggests that corporate earnings of the index as a whole were projected to grow; i.e., less of an investor’s share dollars as of the valuation date would be required to buy $1 of future S&P 500 corporate earnings. However, keep in mind that the projected P/E is based on company forecasts, while the trailing P/E is based on actual results.
The return and principal value of stocks fluctuate with changes in market conditions. Shares, when sold, may be worth more or less than their original cost. Projections are based on current conditions, subject to change, and may not come to pass.
1) S&P Dow Jones Indices, 2026; 2) FactSet, January 9, 2026
Prepared by Broadridge Investor Communication Solutions, Inc. Copyright 2026.


